Supercharge Your AGM Presentation with Exclusive PE Insights
Save time on AGM prep with our complimentary pack of curated macro insights.
Preparing for your Annual General Meeting? Get a head start with our complimentary AGM Deck. Leveraging DealEdge's proprietary data and Bain's advisory expertise, we've curated the top 5 charts that highlight broader market trends and macro-level insights to elevate your next investor presentation.
What's inside
What's inside
MOIC Returns Chart
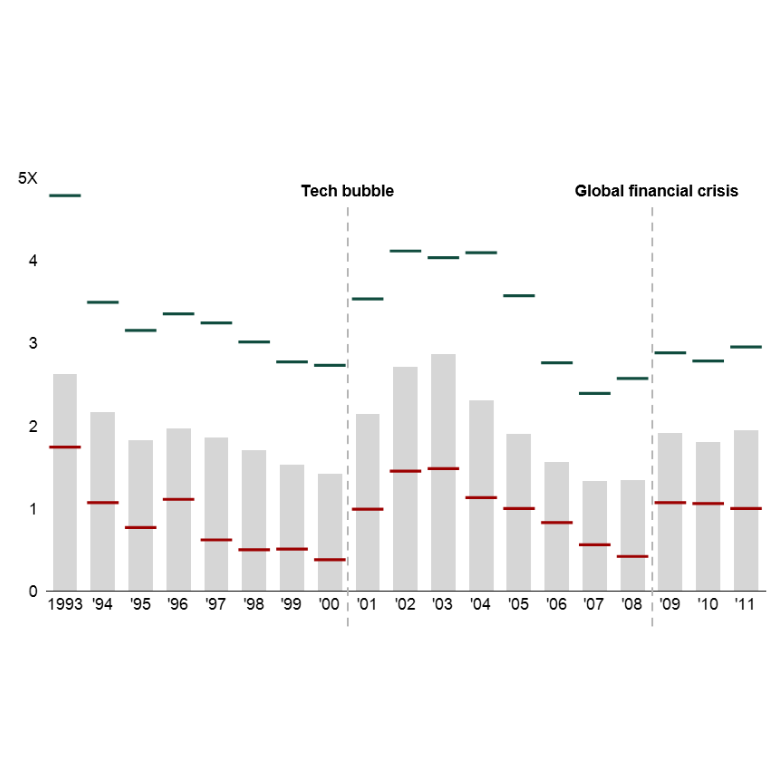
This chart displays the Gross deal MOIC (Multiple on Invested Capital) for deals entered from 1993 to 2023. MOIC is an alternative metric to IRR for measuring financial returns in Private Equity. It represents the sum of realized and unrealized returns divided by the total amount invested.
Loss Rate
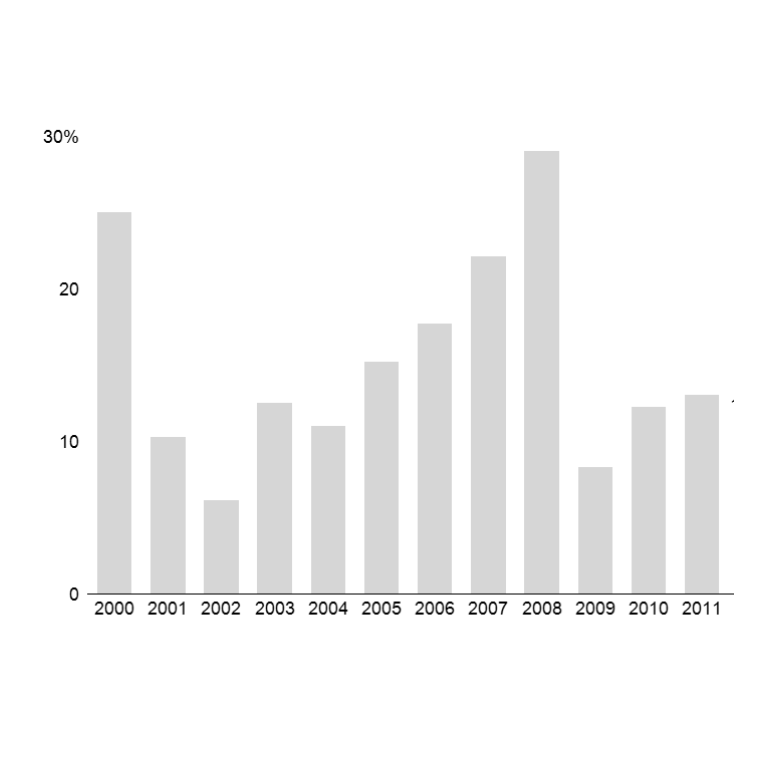
This chart shows the loss rates for deals entered between 2000-2023. The loss rate is calculated as the ratio of losses (deals with MOIC below 1) to the total contributions across all selected deals.
Value Creation
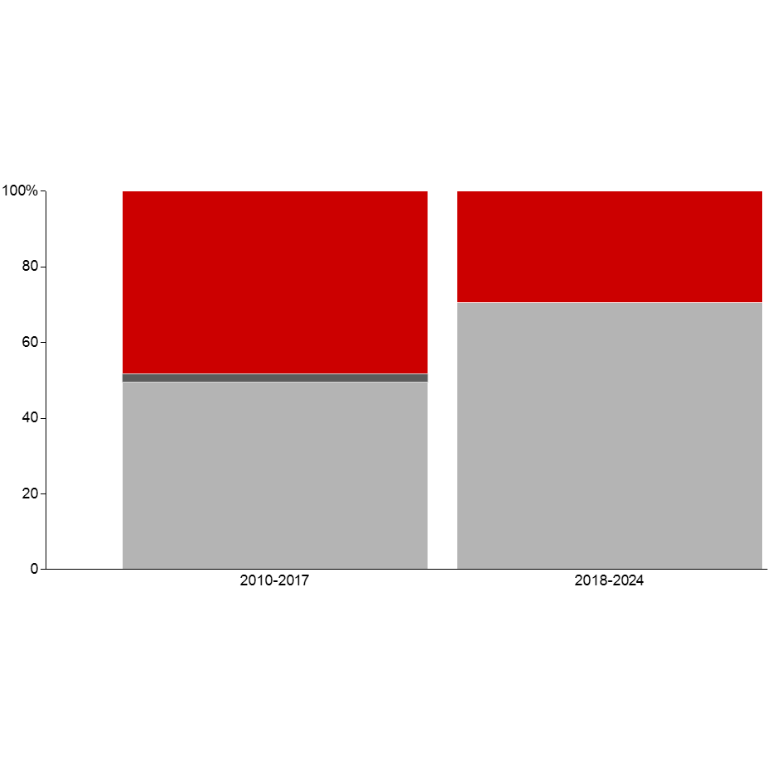
This chart breaks down the percentage contribution of revenue growth, margin expansion, and multiple expansion to the overall value creation in deals entered from 2000-2024.
Buyout EV/ EBITDA Multiples
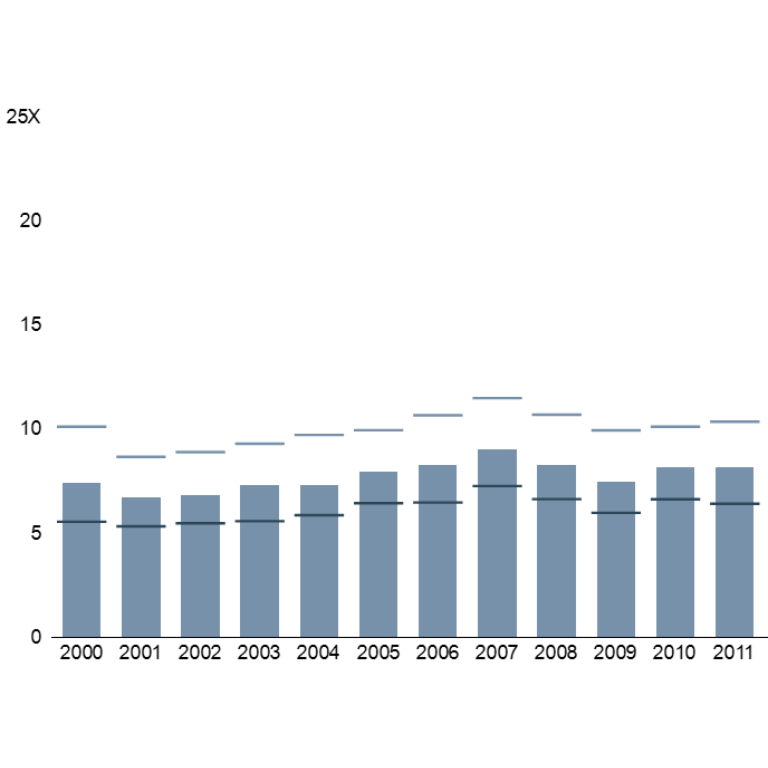
This chart presents the EV/EBITDA multiples (Enterprise Value divided by EBITDA) observed in Buyout deals entered from 2000-2023.
Growth EV/ Revenue Multiples
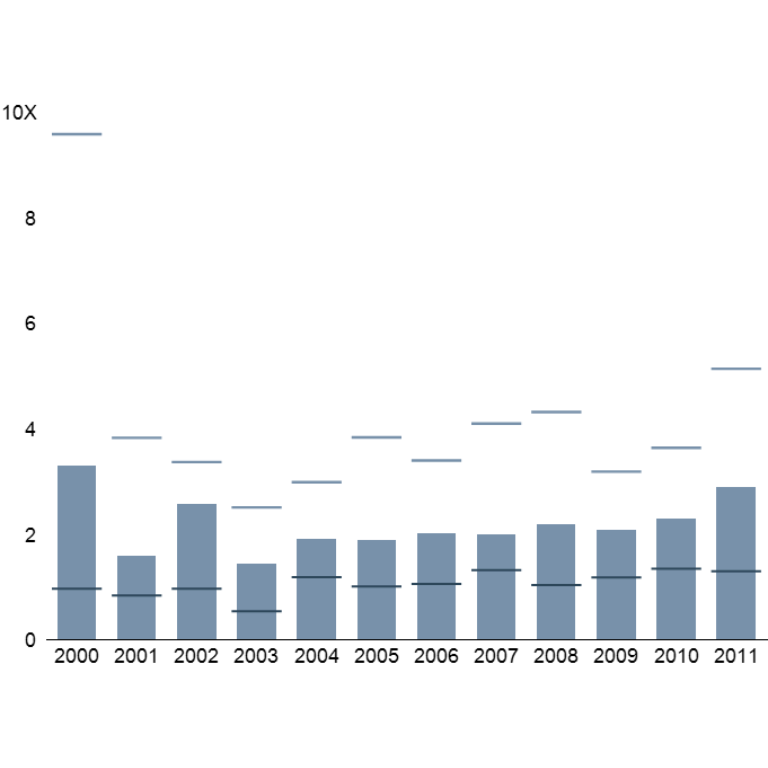
This chart displays the EV/Revenue multiples (Enterprise Value divided by Revenue) for Growth deals entered from 2000-2023.
More about the deck
More about the deck
- Proprietary Deal-Level Data: The charts are built using GP-reported deal data from DealEdge's database of nearly 50,000 deals
- Tailored to the Market: The insights are curated based on feedback from DealEdge customers and Bain advisory work
- Customizable Comprehensive Coverage: Our database spans 570+ subsectors, allowing for customization to your specific portfolio
How to use the deck
How to use the deck
Get instant access to these exclusive insights and save hours of research and analysis with our ready-to-use charts.
- Quick AGM Prep: Download the pack instantly, review the 5 pre-made charts, and incorporate into your next AGM presentation.
- Customize for Your Firm: Click the "Customize" button on any slide and get in touch with a DealEdge expert who can customize the data for a specific sector, geography, entry year etc.
- Dive Deeper: Use the charts as a starting point for further analysis and then request access to the source data and get a guided tour of the entire dataset exploring trends and patterns relevant to your portfolio.
- Benchmark Performance: Compare your firm's metrics against industry standards. Identify areas of strength and opportunities for improvement.
- Ongoing Reference: Keep the deck handy for quick access to key PE metrics. Use as a template for future DealEdge data requests.
Download today!
Download today!

Click for instant access.