Blog
At a Glance
This blog is part of our case study on historic private equity deal performance during periods of high inflation. In the second part of the series, we continue to look at the previous high inflation period of 1989-91 to examine the drivers behind the overall performance picture
Sign up to DealEdge insights
Register your details to receive DealEdge insights, analysis and updates directly to your inbox
High inflation presaged a radical shift in which sectors produced the highest returns

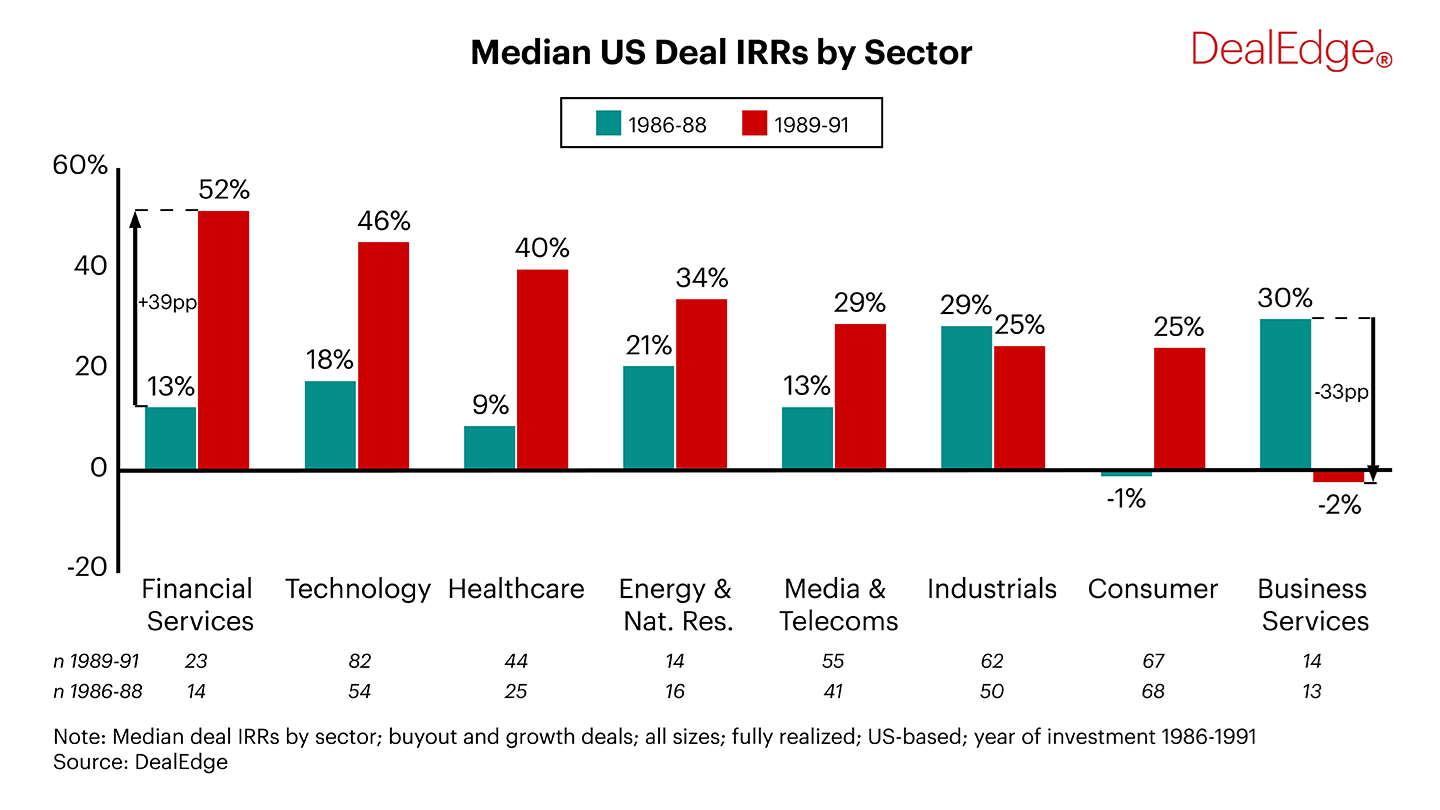
- In the pre-inflation period 1986-88, Business Services and Industrials deals had the highest median IRRs, at 30% and 29% respectively.
- While Industrials deal performance remained steady among those deals entered in the high inflation period, the IRRs for Business Services deals fell into negative territory, with a median negative 2% IRR.
- Almost all sectors had higher median returns among deals entered in the high inflation period – only Business Services and Industrials deals saw their median performance fall.
- By contrast, Financial Services and Technology deals made during high inflation thrived, with median returns exceeding 40%. This represented a quadrupling for Financial Services IRRs, jumping from 13% among deals entered in 1986-88 to 52% among deals entered in 1989-91.
Deals made during high inflation had a higher but wider spread of returns

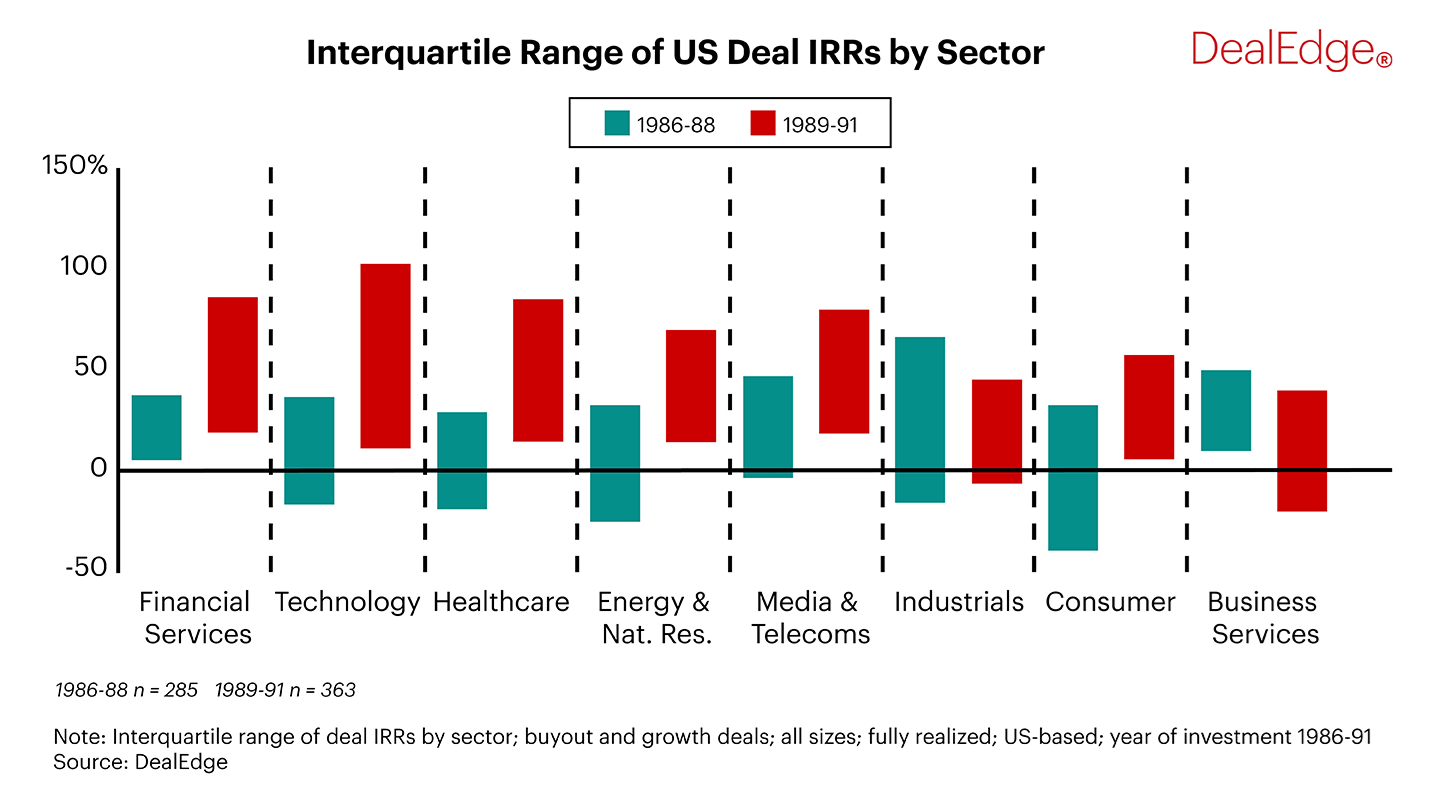
- Deals made in 1989-91 had higher IRRs than 1986-88 deals in both the top and bottom quartiles across almost all sectors.
- Only Industrials and Business Services deals made in 1986-88 had higher top quartiles than their later counterparts.
- However, the spread of returns during the high inflation period is much larger – as much as 80 percentage points among Technology deals.
- Overall, the difference between the top and bottom quartiles within each sector is greater than the difference between the median values across sectors.
The proportion of deals that didn’t grow in value was much higher among pre-inflation period acquisitions

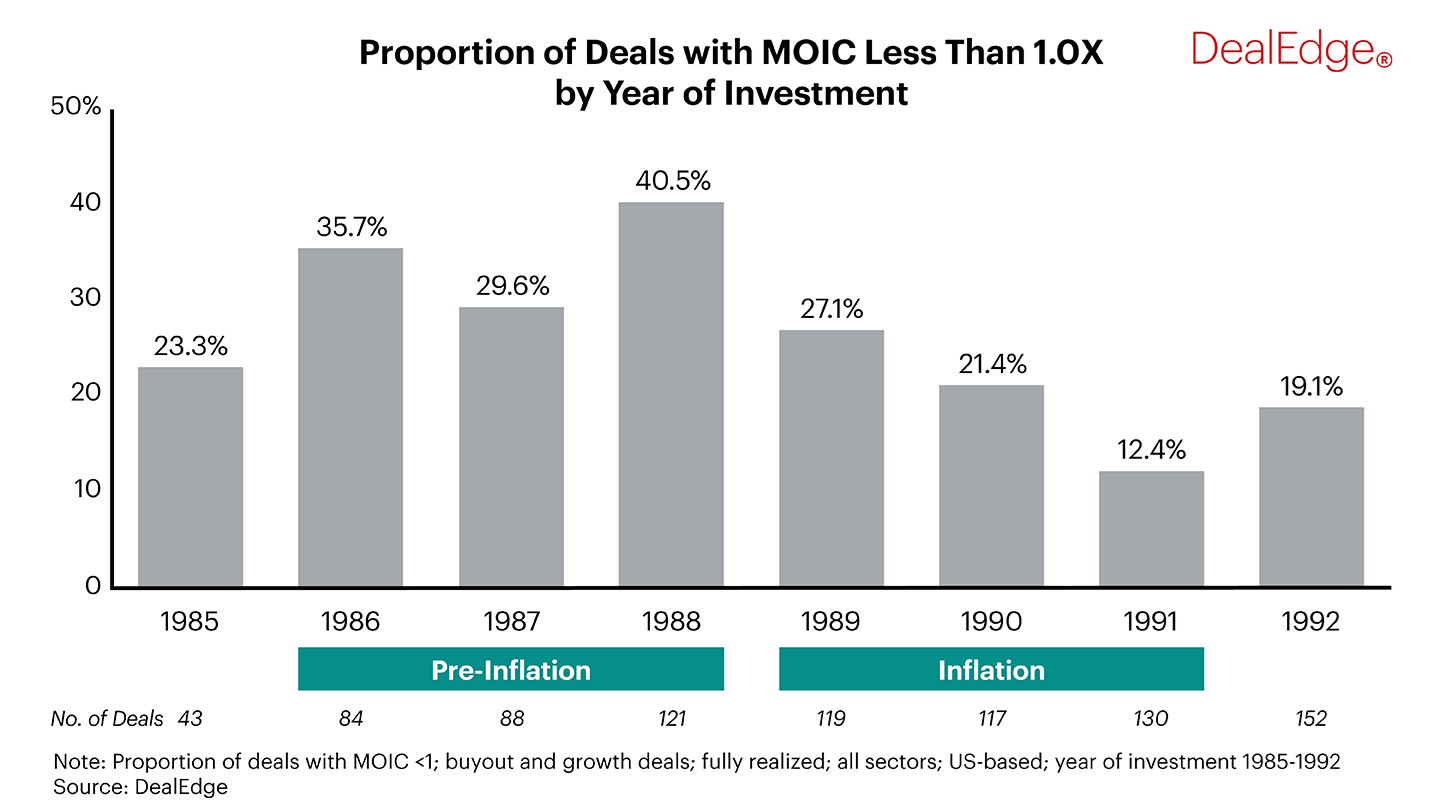
- Overall, 36% of deals made in 1986-88 returned a multiple on invested capital (MOIC) of less than 1.0X. This contrasts with just 20% of deals made in 1989-91.
- The proportion of deals that did not grow in value from entry to exit was higher in each year of the pre-inflation period than in any year of the high inflation period.
- During the high inflation period of 1989-91, the rate of deals with a MOIC less than 1.0X was on par with the more stable inflation periods of 1985 and 1992 – it was the pre-inflation period in which the rate spiked.
Want to understand more about what drove returns in different sectors? Request a DealEdge demo to get faster, smarter answers to guide your strategic decision-making
Sharpen your investment edge
Speak to us today and see how you can power up your private equity program
Request Demo


